skip to main |
skip to sidebar
Wednesday, November 30, 2011
Posted by
Corey Harrell
In this edition of linkz the theme goes from exploitation to infection to detection. Some linkz discussed include: providing clarity about my exploit artifacts, a spear-phishing write-up, a malware analysis checklist, and thoughts about automated vs in-depth malware analysis.
Picking Vulnerabilities
Over the past year I’ve been conducting research to document attack vector artifacts. Vulnerabilities and the exploits that target them are one component to an attack vector. Some may have noticed I initially focused most of my efforts on vulnerabilities present in Adobe Reader and Java. I didn’t pick those applications by flipping a coin or doing “eeny, meeny, miny, moe”. It is not a coincidence I’m seeing exploit artifacts left on systems that target those applications. This has occurred because I pick vulnerabilities based on the exploits contained in exploit packs.
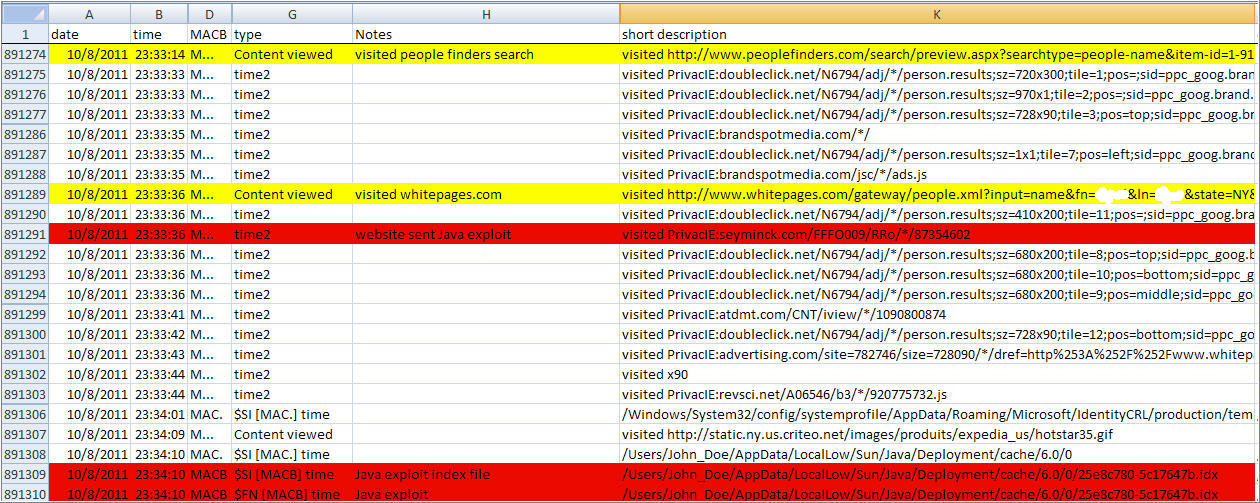
Exploit packs are toolkits that automate the exploitation of client-side vulnerabilities such as browsers, Adobe Reader, and Java. Mila Parkour over at Contagio maintains an excellent spreadsheet outlining the exploits available in different exploit packs on the market. The reference by itself is really informative. The screenshot below shows part of the vulnerabilities section in the spreadsheet.
Notice how many Java and Adobe vulnerabilities are on the list. Maybe now it’s a little more clearer why I wrote about Adobe/Java exploits and why I wasn’t surprised when system after system I keep finding artifacts associated with those exploits. The spreadsheet shows what applications exploit packs are targeting. I’ve been using the document as a reference to help me decide what exploit artifacts to document. Down the road when I start looking into Word, Excel, and flash exploits then at least there will be a little more clarity as to what I’m choosing to document.
Another Adobe Flash Exploit
Since I mentioned both Adobe, flash, and exploit in the same paragraph then I might as well mention them in the same sentence. Zscaler ThreatLab blog recently posted Adobe Flash “SWF” Exploit still in the Wild. The short write-up discusses how a vulnerability in Adobe flash (CVE-2011-0611) is being exploited by embedding a .swf file into Microsoft Office documents or html pages. I wanted to highlight one specific sentence "this exploit code embeds a “nb.swf” flash file into a webpage, which is then executed by the Adobe Flash player". That one sentence identified numerous potential artifacts one could find on a system indicating this attack vector was used. First there will be Internet browser activity followed by a flash file being accessed. The system may then show a swf file being created in a temporary folder and there may also be indications that Adobe flash executed shortly thereafter. The write-up doesn't go into what artifacts are left on a system since its focus is on how the attack worked. At this point those potential artifacts are just that potential. However, flash exploits are third on my list for what I'm going to start documenting. It shouldn’t come as a surprise by now that Mila’s spreadsheet also shows a few exploit packs targeting the flash vulnerability.
Walking through a Spearphishing Attack
The Kahu Security blog post APEC Spearfish does an excellent job walking the reader through an actual spearphishing attack. The spearphish was an email targeted at a single individual and contained a malicious PDF attachment. There was a flash object in the PDF file that exploited a vulnerability in Adobe Flash Player (yup … CVE-2011-0611). The end result was a malware infection providing backdoor access for the attackers. The post isn't written from the DF perspective; it doesn't outline the artifacts on a system indicating a spearphish occurred or a flash exploit caused the malware infection. However, it does a great job breaking down the attack from the person receiving the email to the PDF file launching to malware getting dropped. One image I liked was the one showing "what’s happening behind the scenes" since it helps DF readers see the potential artifacts associated with the method use to infect the system.
Finding Malware Checklist
Last month Harlan posted about his experience at PFIC 2011. At the end of his post he shared his Malware Detection Checklist which outlines the examination steps to locate malware on the system. I think it’s a great list and I like how the checklist is focused on a specific task; finding malware. I added some of the activities in Harlan’s checklist to my own because I either wasn’t doing it or I wasn’t deliberate about doing it. One step I wasn’t doing was scanning for packed files and thinking about it I can see how it can help reduce the amount of binaries to initially examine. On the other end, one step I wasn’t deliberate about was examining the user’s temporary directories. I was examining these directories through timeline analysis but I wasn’t deliberate about searching the entire folder for malware or exploit artifacts.
The cool thing about Harlan’s checklist is that he already did the heavy lifting. He put together a process that works for him (including the tools he uses) and is sharing it with the community. It wouldn’t be hard for anyone to take what he already did and incorporate it into their own examination process. Plus, his blog post mentioned the checklist came from Chapter 6 in WFA 3 so the book (once released) can be a reference to better understand how to go about finding malware on a system.
Another Angle at Finding Malware
Along the same lines about trying to identify malware on a system Mark Morgan over at My Stupid Forensic Blog discussed the topic in his post How to Identify Malware Behavior. Mark first proceeded to explain the four main characteristics of malware which are: an initial infection vector, malware artifacts, propagation mechanism, and persistence mechanism. (Harlan also described these characteristics on his malware webpage). The characteristics are important since there artifacts associated with them and those artifacts can help identify the malware. Mark provided a great example about how the persistence mechanism played a role in one of his cases. He even went on to explain a few different ways to track down malware and its persistence mechanism.
Analyzing Malware
At some point during the examination malware will be identified on the system. Some can just start analyzing the malware since they are fortunate enough to know how to reverse engineer its functionality or know someone who can. The rest of us may not have that luxury so we should just upload the sample to online scanners such as VirusTotal or Sandboxes right? Well, I wouldn’t be too fast in pulling the trigger without understanding the risks involved. The Hexacorn blog put together the excellent post Automation vs. In-depth Malware Analysis. In the author’s own words the "post is my attempt to summarize my thoughts on the topic of both automated malware analysis in general and consensual submission of files to a web site owned by a third party". There are times when submitting samples to a third party service are not the best choice to make. I first learned about the risk when a discussion occurred in the Win4n6 group sometime ago but the post goes into more depth. For anyone dealing with malware and considering using third party services -such as VirusTotal or ThreatExert - than I highly recommend reading this post to help you make an informed decision.
On a side note, the Hexacorn blog started to post forensic riddles every Friday followed by posting the answer every Monday. The riddles are entertaining and educational. My stat count so far is zero for two (I wasn’t even close).
Sunday, November 20, 2011
Posted by
Corey Harrell
There are different ways to spread malware. Email, instant messaging, removable media, or websites are just a few options leveraged to infect systems. One challenge when performing an examination is determining how the malware ended up on the system which is also referred to as identifying the malware’s initial infection vector (IIV). A few obstacles in determining the IIV is that a system changes over time: files are deleted, programs are installed, temporary folders are emptied, browser history is cleared, or an antivirus program cleaned the system. Every one of those obstacles may hinder the examination. However, they don’t necessary result in not being able to narrow down the IIV since some artifacts may still be present on the system pointing to the how.
There are various reasons provided why an examination isn’t performed on a malware infected system to locate the IIV. I first wanted to point out why taking the time to find the IIV is beneficial instead of focusing on the reasons why people don’t. The purpose of the root cause analysis is to identify the factors lead up to the infection and what actions need to be changed to prevent the reoccurrence of a similar incident. If the infected system is just cleaned and put back into production then how can security controls be adjusted or implemented to reduce malware infecting systems in a similar manner? Let’s see how this works by skipping the root cause analysis and placing blame on a user opening a SPAM email. A new security awareness initiative educates employees on not opening SPAM email which does very little if the malware was a result of a break down in the patch management process. Skipping figuring out the IIV is not only a lost opportunity for security improvements but it prevents knowing when the infection first occurred and what data may have been exposed. This applies to both organizations and individuals.
Determining how the malware infected a system is a challenge but that's not a good enough reason to not try. It may be easier to say it can’t be done, takes too much resources or it's not worth it since someone (aka users) never listen and did something they weren’t suppose to. As a learning opportunity I’m sharing how I identified the initial infection vector in a recent examination by showing my thought process and tool usage.
First things first… I maintain the utmost confidentiality in any work I perform whether if it’s DFIR or vulnerability assessments. At times on my blog I write detailed posts about actual examinations I performed and every time I’ve requested permission to do so. This post is no different. I was told I can share the information for the greater good since it may help educate others in the DFIR community who are facing malware infected systems.
Background Information
People don’t treat me as their resident “IT guy” to fix their computer issues anymore. They now usually contact me for another reason because they are aware that I’ve been cleaning infected computers for the past year free of charge. So it’s not a strange occurrence when someone contacts me saying their friend/colleague/family member/etc appears to be infected with a virus and needs a little help. That’s pretty much how this examination came about and I wasn’t provided with any other information except for two requests:
* Tell them how the infection occurred so they can avoid this from happening again
* Remove the viruses from the computer
Investigation Plan
The methodology used throughout the examination is documented on the jIIr Methodology Page. I separated the various system examination steps into the first three areas listed below.
1. Verify the system is infected
2. Locate all malware present on the system
3. Identify the IIV
4. Eradicate the malware and reset any system changes
I organized the areas so each one will build on the previous one. My initial activities were to verify that the system was actually infected as opposed to the requester interpreting a computer issue as an infection. To accomplish this I needed to locate a piece of malware on the system either through antivirus scanning or reviewing the system auto-run locations. If malware was present then the next thing I had to do was locate and document every piece of malware on the computer by: obtaining general information about the system, identifying files created around the time frame malware appeared, and reviewing the programs that executed on the system. The examination would require since the technique excels at highlighting malware on a system. The third area and the focus of this post was to identify the initial infection vector. The IIV is detected by looking at the system activity in the timeline around the timeframe when each piece of malware was dropped onto the system. The activity can reveal if all of the malware is from the same attack or if there were numerous attacks resulting in different malware getting dropped onto the system. The final area is to eradicate every malware identified.
Note: Some activities were conducted in parallel to save time. To make it easier for people to follow my examination I identified each activity with the symbol <Step #>, the commands I ran are in bold, and registry and file paths are italicized.
Verifying the Infection
The computer’s hard drive was connected to my workstation and a software write blocker prevented the drive from being modified. I first reviewed the master boot record (MBR) to see the drive configuration I was dealing with and to check for signs of MBR malware <Step 1>. I ran the Sleuthkit command: mmls.exe -B \\.\PHYSICALDRIVE1 (the -B switch shows the size in bytes). There was nothing odd about the hard drive configuration and I found out that additional time was needed to complete the examination since I was dealing with a 500 GB hard drive. To assist with identifying known malware on the system I fired off a Kaspersky antivirus scan against the drive <Step 2>.
Knowing the antivirus scan was going to take forever to complete I moved on to checking out the system’s auto-runs locations for any signs of infection. The Sysinternals AutoRuns for Windows utility was executed against the Windows folder and the only user profile on the system <Step 3>. In the auto-runs I was looking for unusual paths launching executables, misspelled file names, and unusual folders/files. It wasn’t long before I came across an executable with a random name in the HKCU\SOFTWARE\Microsoft\Windows NT\CurrentVersion\Winlogon\Shell registry key.
The HKCU\Software\Microsoft\Windows\CurrentVersion\Run registry key also listed under Auto-runs Logon tab showed that the C:\Users\John_Doe\AppData\Roaming folder had more than just one randomly named executable. The key also showed an additional location which was the C:\Users\John_Doe\AppData\Roaming\Microsoft folder.


Monday, November 14, 2011
Posted by
Corey Harrell
Last week I had the opportunity to attend Paraben’s Forensic Innovations Conference (PFIC). I had a great time at PFIC; from the bootcamp to the sessions to the networking opportunities. Harlan posted his experience about PFIC, Girl Unallocated shared her thoughts, and SANs Digital Forensic Case Leads discussed the conference as well. The angle I’m going to take in my post is more of a play by play about the value PFIC offers and how the experience will immediately impact my work. Here are a few of my thoughts ….
Affordability
When I’m looking at conferences and trainings the cost is one of the top two things I consider. This is especially true if I’m going to ask my employer to pick up the tab. Similar to other organizations it is extremely hard to get travel approved through my organization. As a public sector employee at times it seems like I’d have better odds getting someone’s first born then to get a request approved through the finance office. The low cost to attend PFIC made it easier for me to get people to sign off on it. The conference with one day training was only $400. The location was the Canyons Resort and attendees got cheaper rates for lodging since it’s the off-season. Rounding out the price tag were the plane flight and shuttle from the airport; both expenses were fairly reasonable. Don’t be fooled by the low costs thinking PFIC is the equivalent of a fast food restaurant while the other conferences are fine dining. PFIC is not only an economical choice but the content covered in the bootcamp and sessions results in more bang for the buck. I like to think PFIC is the equivalent of fine dining with coupons. The cost was so reasonable that I was even going to swing the conference by myself if my employer denied my request to attend. That’s how much value I saw in the price tag especially when I compared it to other DFIR conferences.
Networking Opportunities
The one commonality I’ve see in other’s feedback about PFIC is how the smaller conference size provides opportunities to network with speakers and other practitioners. This was my first DFIR conference so I can’t comment about conference sizes. However, I agree about the ability to talk with people from the field. Everyone was approachable during the conference without having to wait for crowds to disperse. Plus if for some reason you were unable to connect between sessions then PFIC had evening activities such as casino night and night out in town. I meet some great people at the conference and was finally able to meet a few people I only talked to online. Going into the conference I underestimated the value in connecting with others since I was so focused on the content.
Content
Let’s be honest. A conference can be affordable and offer great networking opportunities but if the content is not up to par then the conference will be a waste of time and money. I have a very simple way to judge content; it should benefit my work in some way. This means none of the following would fit the bill: academics discussing interesting theories which has no relevance to my cases, vendors pimping some product as the only way to solve an issue, or presenters discussing a topic at such a high level there is no useful information I can apply to my work. One thing I noticed about the PFIC presenters was they are practitioners in the field discussing techniques and tools they used to address an issue. Pretty much each session I walked away from I felt like I learned a few useful things and got a few ideas to research further. Harlan said in his PFIC 2011 post that “there were enough presentations along a similar vein that you could refer back to someone else's presentation in order to add relevance to what you were talking about”. I think the same thing can be said from the attendee’s perspective. I sat through several presentations on incident response and mobile devices and it seemed as if the presentations built on one another.
I pretty much picked my sessions on a topic I wanted to know more about (incident response) and another topic I wanted to get exposed to (mobile devices). There were a few presentations I picked based on the presenter but for the most part my focus was on incident response and mobile devices. PFIC had a lot more to offer including e-discovery, legal issues, and digital forensics topics but I decided to focus on two specific topics. In the end I’m glad I did since each presentation discussed a different area about the topic which gave me a better understanding. I’m not discussing every session I attended but I wanted to reflect on a few.
Incident Response
I started PFIC by attending the Incident Response bootcamp taught by Ralph Gorgal. The overview about the process used in the session is shown below and the activities highlighted in red is what the bootcamp focused on (everything to the right of the arrows are my notes about the activity).
* Detection => how were people made aware
* Initial Response => initial investigation, interviews, review detection evidence, and facts that incident occurred
* Formulate Investigation/Collection Strategy => obtain network topology and operating systems in use
* Identify Location of Relevant Evidence => determine sources locations, system policies, and log contents
* Evidence Preservation => physical images, logical images, and archive retrieval
* Investigation
* Reporting
The approach taken was for us to simulate walking in to a network and trying to understand the network and what logs were available to us. To accomplish that we reviewed servers’ configurations including the impact different configuration settings have and identified where the servers where storing their logs. The Windows services explored during the bootcamp were: active directory, terminal services, internet information server (IIS), exchange, SQL, and ISA. The focus was more on following a logical flow through the network (I thought it was similar to the End to End Digital Investigation) and thinking about what kind of evidence is available and where it was located.
The bootcamp provided a thorough explanation about the thought process behind conducting log analysis during incident response. Even though the course didn’t touch on how to perform the log analysis other sessions offered at PFIC filled in the void. The first session was We’re infected, now what? How can logs provide insight? presented by David Nardoni and Tomas Castrejon. The session started out by first explaining what logs are, breaking down the different types of logs (network, system, security, and application), and explaining what the different log types can tell you. The rest of the session focused on using the free tools Splunk and Mandiant’s Highlighter to examine firewall and Windows event logs. I thought the presentation was put together well and the hands on portion examining actual logs reinforced the information presented to us. The other session I attended about log analysis was Log File Analysis in Incident Response presented by Joe McManus. The presentation was how web server and proxy logs can generate leads about an incident by using the open source tool Log Analysis Tool Kit (LATK). LATK helps to automate the process of log analysis by quickly showing log indicators such as top downloaders/uploaders, SQL queries, and vulnerable web page access. The session was a lab and in the hands on portion we examined web server and proxy logs. This was another session that was well put together and I think the coolest thing about both sessions, besides the great information shared, was that free tools were used to perform log analysis.
Mobile Devices
Mobile devices are a topic I want to become more knowledgeable about. I went into PFIC wanting to learn a basic understanding about the forensic value contained in mobile devices and get some hands on experience examining them.
The first of the three Paraben labs I attended was Smartphone and Tablet Forensic Processing by Amber Schroader. This wasn’t my scheduled lab so I watched from the back as others did the hands on portion. Amber laid out a case study for the attendees who had to locate a missing 15 year old girl by using Device Seizure to examine an ipad and itouch. What I liked about the session was that answers weren’t provided to the audience which forced them to have to figure out what information on those devices could help locate the girl. A few of the areas examined included: Safari browsing history, Safari download history, Youtube history, facetime history, wifi locations, and pictures. After the case study Amber laid out the different areas on mobile devices containing relevant information but mentioned the biggest issue with mobiles is the sheer number of apps which changes how you look at your data. The next Paraben lab I sat through was Physical Acquisitions of Mobiles by Diane Barrett. The session explained the different methods to acquire a physical image which were chip off, JTAG test access port, flasher boxes, and logical software that can do physical. The cool part about the session was the hands on portion since we used a Tornado flasher box and Device Seizure to acquire a physical image from a Motorola phone. The last Paraben lab I attended was Introduction to Device Seizure by Amber Schroader and Eric Montellese. As the title indicates the session was an introduction on how device seizure can be used to examine mobile devices. The entire session was pretty much hands on; we performed logical and physical acquisitions of a Motorola phone and a logical acquisition of an Android. We also briefly examined both devices to see what information was available.
The only non-Paraben session about mobile devices I attended was iOS Forensics by Ben Lemere. The presentation discussed how to perform forensics on iOS devices using free tools. The information provided was interesting and added to my to-do list but I thought the session would have been better if it was a lab. It would have been awesome to try out the stuff the presenter was talking about.
Digital Forensic Topics
I couldn’t come up with a better description than Digital Forensics Topics for the sessions I picked based on the presenter or topic. The one session I wanted to mention in this category was Scanning for Low Hanging Fruit in an Investigation by Harlan Carvey. I was really interested in attending Harlan’s session so I could finally see the forensic scanner he has been talking about. Out of all of the sessions I attended I think this was the only session where I knew about the topic being discussed (I follow Harlan’s blog and he has been discussing his forensic scanner). Harlan explained how the scanner is an engine that runs a series of checks searching for low hanging fruit (known artifacts on the system). The usage scenario he laid out involves:
* Mount an acquired image as a volume (or mount a volume shadow copy)
* Plug-ins (checks) are based on a specific usage profile
* Scanner reports are generated including a log of activity (analysts name, details image, plugins ran, etc.)
Harlan mentioned the scanner is still in development but he still did a tool demo by parsing a system’s Windows folder. A few things I noted about what I saw: there’s better documentation than Regripper (analysts name and platform included), still rips registry keys, lists files in a directory (prefetch folder contents were showed), runs external programs (evt.pl was executed), hashes files, and performs different file checks. I saw the value in this kind of tool before I sat through the session but seeing it in action reinforces how valuable this capability would be. I currently try to mimic some activities with batch scripting (see my triage post or obtaining information post). Those scripts took some time to put together and would require some work to make them do something else. I can foresee the forensic scanner handling this in a few seconds since plugins would just need to be selected; plus the scanner can do stuff that's impossible with batch scripting.
Speaking of scripts … Harlan mentioned during his presentation a batch script I put together that runs Regripper across every volume shadow copy (VSC) on a system. I was caught a little off guard since I'd never imagined Harlan mentioning my work during his presentation. I probably didn’t do a good job explaining the script during the session since I wasn’t expecting to talk about it. Here is some information about the script. As Harlan mentioned, I added functionality to the script besides running Regripper (I still have a standalone script for Regripper in case anyone doesn’t want the other functions). The script can identify the differences between VSCs, hash files in VSCs, extract data (preserves timestamps and NTFS permissions) from VSCs, and list files in the VSC. The script demonstrates that you can pretty much do as you please with VSCs whether if you are examining a forensic image or live system. In a few weeks I’ll provide a little more information about the script and why I wrote it, and over the next few months I’ll write a series of posts explaining the logic behind the script before I release it.
PFIC Summary
Overall PFIC was a great experience. I learned a lot of information, I have a to-do list outlining the various things to research/test further, and I meet some great people. The return on investment for my company sending me to the conference is that in a few weeks I’ll be able to perform log analysis, I’m more knowledgeable about mobile device forensics, and if I get into a jam I now have a few people I can reach out to for help.
Closing out my post I wanted to share a few thoughts for improvement. I didn’t have many which I guess is a good thing. ;)
1. Make the names on the name tags bigger. I think my biggest struggle during the conference was trying to figure out peoples’ names since I couldn’t read the tags.
2. Presenters should answer all questions during the session if time permits; especially if the question is a follow-up to something the presenter said. Another attendee asked a great question but I had to stick around for about five minutes after the session to hear the answer. It wasn’t like the question was controversial or something.
3. Verify that all equipment works before the session. One of the labs hit a speed bump when numerous attendees (me included) couldn’t acquire a phone since numerous phones didn’t work. Everyone was able to do the acquisition eventually but time was lost trying to find phones that actually worked.